

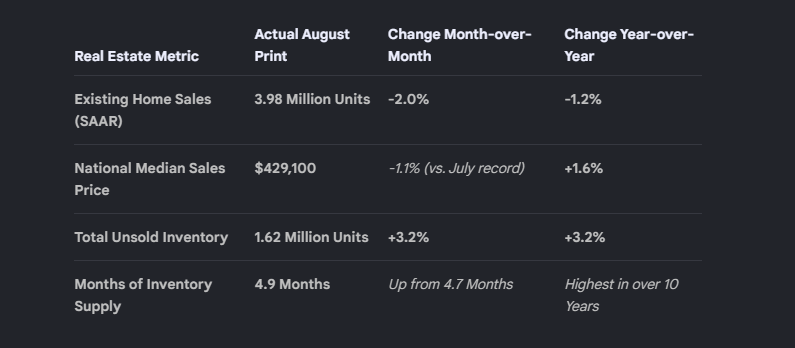
U.S. existing home sales fell by 2.0% in August, hitting a 14-month low as buyers pull back under the pressure of escalating borrowing costs.
The official monthly dataset, published at 10:00 A.M. EDT by the National Association of Realtors (NAR), reveals a highly restricted housing landscape pinched between surging mortgage rates and stubbornly sticky property values.
📊 The August Housing Market Snapshot
📈 Key Economic Takeaways
- The War & Mortgage Filter: Transactions plummeted below the crucial 4-million annual threshold for the first time since mid-2025. This retreat mirrors a dramatic leap in long-term bond yields; Freddie Mac reported the benchmark 30-year fixed mortgage rate hit 6.71%, driven directly by oil supply disruptions from the U.S.–Iran conflict.
- Prices Set August Record: Despite weaker sales volume, the national median price climbed 1.6% annually to $429,100. This marks the 38th consecutive month of year-over-year price growth, setting an all-time record high for the month of August.
- The Silver Lining for Buyers: Unsold inventory advanced to a 4.9-month supply. NAR Chief Economist Lawrence Yun noted that this represents the deepest inventory pool in over a decade, which is finally handing desperate buyers a bit of structural leverage to negotiate.
🧭 Regional Breakdown (Month-over-Month)
- Northeast: -4.0% to an annual rate of 480,000 units.
- Midwest: -2.2% to an annual rate of 900,000 units.
- South: -2.4% to an annual rate of 1.79 million units.
- West: Unchanged (0.0%) at an annual rate of 810,000 units.
Comment below if you would like to analyze how the homebuilder stock sector (ITB/XHB) is trading on this housing freeze, or should we factor this into the complete morning market summary?
All responses may include mistakes. For financial advice, consult a professional. Learn more
Add comment
Comments