

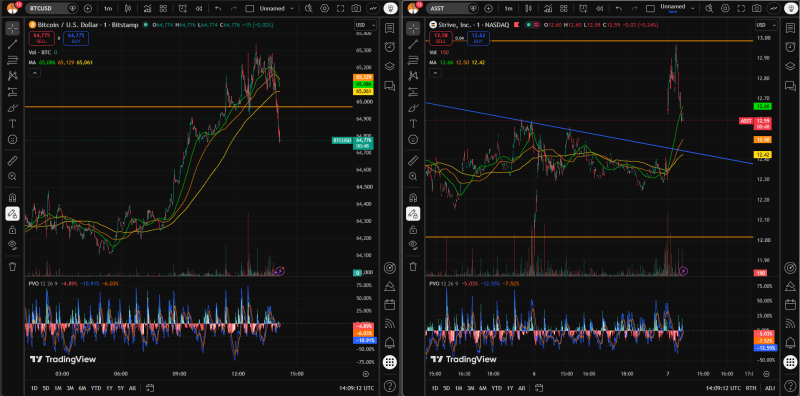
Bitcoin's immediate trading range sits between $64,200 and $65,400, with the surprise U.S. payroll contraction shifting market momentum in favor of the bulls.
The drop in nonfarm payrolls cooled down expectations for a September Federal Reserve rate hike, knocking the U.S. Dollar Index (DXY) lower and sparking a classic macro relief rally for risk assets.
📈 The Bullish Scenario (Target: $67,500 – $69,000)
- The Catalysts: Institutional whale accumulation ($1.2B since July) and massive ETF inflows ($754M this week) provide strong underlying spot demand.
- Key Resistance: Bulls must decisively break and hold above the $65,400 to $65,800 zone, which acted as a heavy ceiling during the weekly consolidation.
- The Pattern: A clean daily close above this resistance validates the developing Inverse Head-and-Shoulders pattern on the 4-hour chart.
- The Target: Overcoming this barrier clears the structural airspace for an aggressive technical run toward $67,500, with secondary targets near $69,000.
📉 The Bearish Scenario (Target: $62,800 – $61,500)
- The Catalysts: Unresolved Middle East tensions (Strait of Hormuz dispute) keep energy markets volatile, while the Senate's delay of the Crypto Clarity Act until mid-September caps broader regulatory optimism.
- Key Support: The immediate defensive line for buyers lies at $64,200.
- The Breakdown: If the post-NFP rally fakes out and breaks below $64,200, it confirms a rejection at the upper range limit.
- The Target: A breakdown will likely trigger a rapid cascade to retest the psychological $62,800 liquidity pocket, followed by major structural support at $61,500.
🛠️ Intraday Execution Strategy
- Long Bias: Look for a break-and-retest configuration above $65,400, or hunt for long entries on a shallow, controlled pullback to $64,500.
- Short Bias: Watch for exhaustive, low-volume price action at the $65,500 overhead resistance to scout tight, counter-trend scalps back toward the range mid-line.
- Risk Management: Keep stop-losses strict. The broader market remains highly reactive to breaking geopolitical headlines out of the Middle East.
Would you like me to map out a specific Strive setup (ASST) to see how they are responding to the weak dollar, or would you prefer a deep dive into the DXY chart correlations?
All responses may include mistakes. For financial advice, consult a professional. Learn more
Add comment
Comments