


Here is your active trade setup for Thursday, October 8, 2026, as the opening bell rings. Today's trading environment is defined by severe macro headwinds clashing with a remarkably resilient domestic economy.
🏁 Market Context & Macro Catalyst
- The Overheated Data: Initial jobless claims dropped unexpectedly to 197,000, beating Wall Street's expectation of 200,000. While this highlights labor market strength, it has sent the 10-year Treasury yield up to a multi-decade high of 5.34%, intensifying fears of an aggressively hawkish Federal Reserve.
- The Energy Shock: Geopolitical conflict in the Middle East has triggered at least nine separate shipping attacks in the Strait of Hormuz this October. Consequently, Brent crude oil has skyrocketed to $104.81 a barrel, draining liquidity away from highly speculative growth and digital assets.
🪙 Bitcoin (BTC) Technical Levels
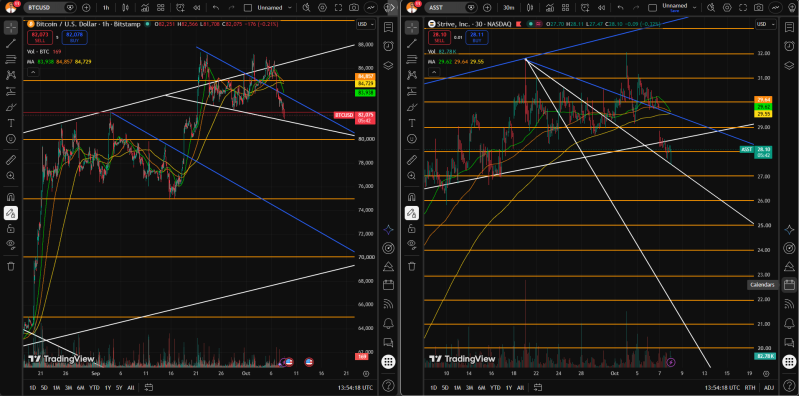
Bitcoin has broken beneath its multi-week consolidation floor, currently trading down 2.7% around $82,347.
- Support Zones: Local support is clustering heavily around $82,000, with a deeper structural trend line resting near $80,700.
- Resistance Levels: Multi-week resistance sits at the previous breakdown level of $84,000, followed by the medium-term psychological cap at $86,000.
- Derivatives Structure: Over $646 million in leveraged long liquidations hit the market over the last 24 hours, cleansing a significant amount of over-leveraged retail positioning.
📊 Strive Inc. (ASST) Technical Levels
As Strive Inc. (ASST) tracks lower this morning to $27.78, its near-term chart is undergoing a significant retest of key short-term moving averages. Despite today's macro pullback, the stock remains in a medium-term upward trend channel, backed by high overall momentum from its recent multi-week run.
📉 Key Support Zones
- Support 1 ($28.73 - $28.50): The previous primary pivot support floor. Breaching this area morning-of puts immediate focus on the active short put contracts.
- Support 2 ($27.55 - $27.15): A heavy cluster of institutional demand and an essential trailing stop-loss baseline. Holding this floor is key to keeping the immediate bullish chart structure intact.
- Support 3 ($25.17): The 8-day Exponential Moving Average (EMA), representing the ultimate fallback safety line for momentum buyers.
📈 Overhead Resistance Levels
- Resistance 1 ($29.41 - $29.75): The stock's recent standard deviation baseline. Reclaiming this zone is the first requirement to flip the intraday narrative back to bullish.
- Resistance 2 ($30.31): The major 1st Pivot Resistance line and psychological breakdown shelf.
- Resistance 3 ($31.89 - $32.41): The multi-month high barrier. A high-volume breakout clear of $32.41 points to an open sky with no major technical resistance up to the target zones near $40.68.
📊 Technical Momentum Oscillators
- RSI (14-Day): Sitting neutral at 51.26, showing that the morning pullback has successfully cleared out the short-term "overbought" risks without dropping the equity into an oversold collapse.
- Moving Averages: The medium-to-long-term trend continues to flash an overarching buy signal, as the stock stays comfortably above its 50-day EMA ($17.49) and its 200-day Simple Moving Average ($20.97).
ChatVIP

- ASST is slamming into its critical $27.55 support floor just as Bitcoin slices below $83,000. In a high-velocity market like this, trading blindly isn't just risky—it's incredibly expensive.
- Get an institutional-grade edge on this pullback completely risk-free. Start your 7-day free trial today to instantly track hidden institutional options walls, unlock live implied volatility data, and find the exact technical zones to maximize your premium collection.
© 2026 Active Investors Club. All Rights Reserved. This article is provided for informational purposes only. It is not offered or intended to be used as legal, tax, investment, financial, or other advice.
Add comment
Comments